Daikin has announced the launch of a new psychrometric diagram viewer, allowing the temperature and humidity of indoor air to be plotted quickly and easily. Simple to use and highly adaptable, the software settings can be adjusted to accept a wide range of variables. The new upgrade is free to download, is the latest in a series of ‘total solution’ tools for installers, developers and consultants.
Daikin’s newest Psychrometric software provides the means to plot moisture levels in building projects. Obtained data is reviewed against a series of parameters and presented as clear, easy to view charts. Available to both professionals and students involved in air conditioning, the software promotes precise capture of the properties of moist air in changing conditions and the resultant effects on the building environment.
“Although this software is not built as a tutorial for learning about the conditions and changes to moist air, we are convinced that this programme can become a valuable tool that will benefit engineers, developers, consultants and students alike enormously”. says Philippe Vandesteene, Mentor in Marketing Department -Digital section, Daikin Europe.
By inputting just two data points from the range of measurement parameters, users can determine the properties of moist air conditions from a comprehensive review of properties such as Dry bulb and Wet bulb temperature, Dew point, relative, absolute humidity and enthalpy, (heat content) density and specific volume. These conditions obviously depend on altitude above sea level.
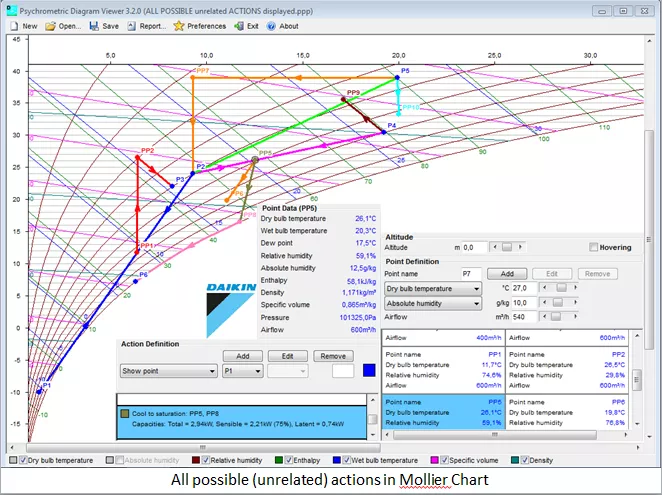
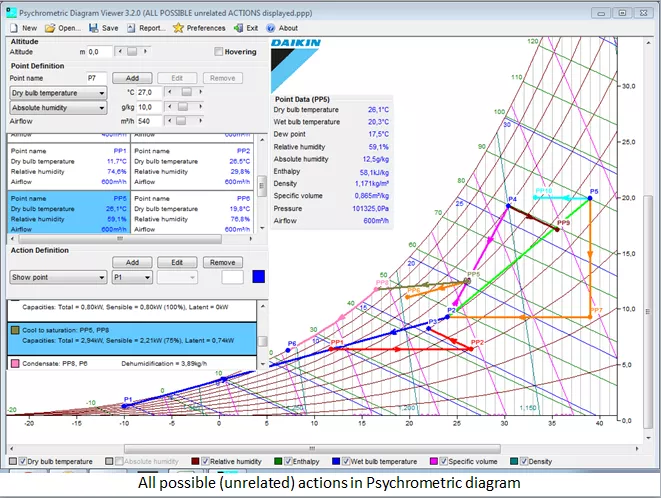
The newly released version 3.2 of Daikin’s psychrometric data viewer offers the ability to plot and adjust points on the graph with the click of a mouse and to ‘zoom in’ to see relevant areas of the chart in more detail. Graphs can be viewed in either Psychrometric or Mollier formats, with data set to Metric or Imperial units and colour coding added for additional ease of interpretation. The flexibility to apply additional variables gives the user the ability to accurately capture and display real time conditions, as well as anticipate changes in environment. For example, users can:
- Show or suppress points or draw and connect additional points
-
Mix air volumes
-
Set the required cooling and heating capacities from P1 to P2 with a selectable SHF in cooling mode.
-
Add steam or water humidification to a condition.
-
Cool to saturation line (using selectable SHF)
-
Condensate to reduce humidity by following saturation line
-
Dehumidification (desiccant drying)
-
Direct integration into the design processes from concept through to functional implementation, means scenarios can be saved and project reports can be generated at any point.
Daikin’s psychrometric software package is available as a
free download* On registration, a manual and
quick start video user guide is also included.
* Please note registration is required – this will help us to improve user experience as we continue to develop the software in the future.