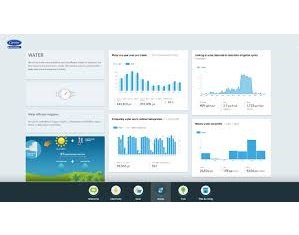
Building owners, operators and energy managers can now leverage the power of data from their i-Vu building automation system to help improve energy performance across buildings. The new EcoReports energy management package allows stakeholders to visualize building data to unlock actionable insights that help them meet their energy conservation and savings objectives.
Designed as a cloud-based, software-as-a-service (SaaS) platform, the new EcoReports package integrates seamlessly and securely with the Carrier i-Vu building automation system. Once connected, the EcoReports package provides operators with powerful visualization tools that help them create customized reports and dashboards using data from their i-Vu system, sub-metering systems, and utility bill invoices. These visualizations make it easy for operators to detect anomalies and identify inefficiencies, while also helping them to increase occupant comfort, productivity and engagement.
“We are excited to add another integrated component to the i-Vu building automation system,” said Mark Jones, business manager, Carrier Controls. “With the new EcoReports energy management package, operators can leverage real-time data from their i-Vu system to create visualizations that help them track spending, identify trends, reduce costs and ultimately create a more sustainable building environment.
The EcoReports package is available in three different versions
EcoReports Storyboard edition: This version takes information from an existing building and makes the data meaningful to those who impact building performance the most —the occupants. The easy-to-use, embedded web capabilities allow operators to incorporate dynamic content featuring real-time building data and display it on a screen in the building lobby. By increasing awareness of energy efficiency programs and sustainability initiatives in a facility, people and teams across an organization are encouraged to collaborate around shared sustainability goals.
EcoReports Dashboards edition: Operators can create shareable graphs, charts, reports and dashboards that offer transparency into the key performance indicators that matter for energy and utility bill management, building performance and sustainability tracking, and for communicating utility spend, budgets and cost allocations to departments and tenants.
EcoReports Custom edition: This version adds several key analysis and visualization capabilities for advanced energy management across a building portfolio. Operators can reconcile utility bills, measure and verify capital projects, create custom tenant dashboards and much more.
The new Carrier EcoReports energy management package helps users:
-
Visualize building data using graphs, charts, reports and dashboards
-
Analyze and normalize energy consumption across buildings
-
Identify performance issues to help maximize building efficiency
-
Improve occupant comfort, productivity and engagement.
